The 2026 Anti-Dynasty List!
Get ready for the 2026 update to the Anti-Dynasty list! The worst of the worst through over 100 years of NFL football, compared, sorted and ranked.

What better way to kick off a new newsletter than with a list of total failures!
I like having big, offseason projects. Some of my favorites are trying to find ways to rank and compare teams across eras, as an excuse to Remember Some Dudes. And one of my all-time favorites is the Anti-Dynasty List.
This all started during the Pandemic, when we were locked in our homes and the future of the NFL season seemed in doubt. That's when I put together the first Dynasty List over at Football Outsiders – a ranking of the most successful runs in NFL history. With those archives now lost to the mists of time and the Wayback Machine, I ran a new, updated version of the list last summer over at FTN.
But as fun as it is to talk about Tom Brady's Patriots or Bill Walsh's 49ers, there's always been something fascinating about utter disasters – the teams that barely manage to piece themselves together. We're talking about the the worst of the worst; the teams that did the most to set football back through combinations of injuries, incompetence and ineptitude. We're here to celebrate the teams that showed up week in and week out, only to lose by four scores in front of nearly empty stands. We're looking at the owners and general managers who went out of their way to make the wrong personnel decisions, torpedoing their teams for years. We're wading through the worst trades, the worst performances, the worst drafts, the worst starters, the worst everything. In short, we're on the hunt to find the worst Anti-Dynasty of all time.
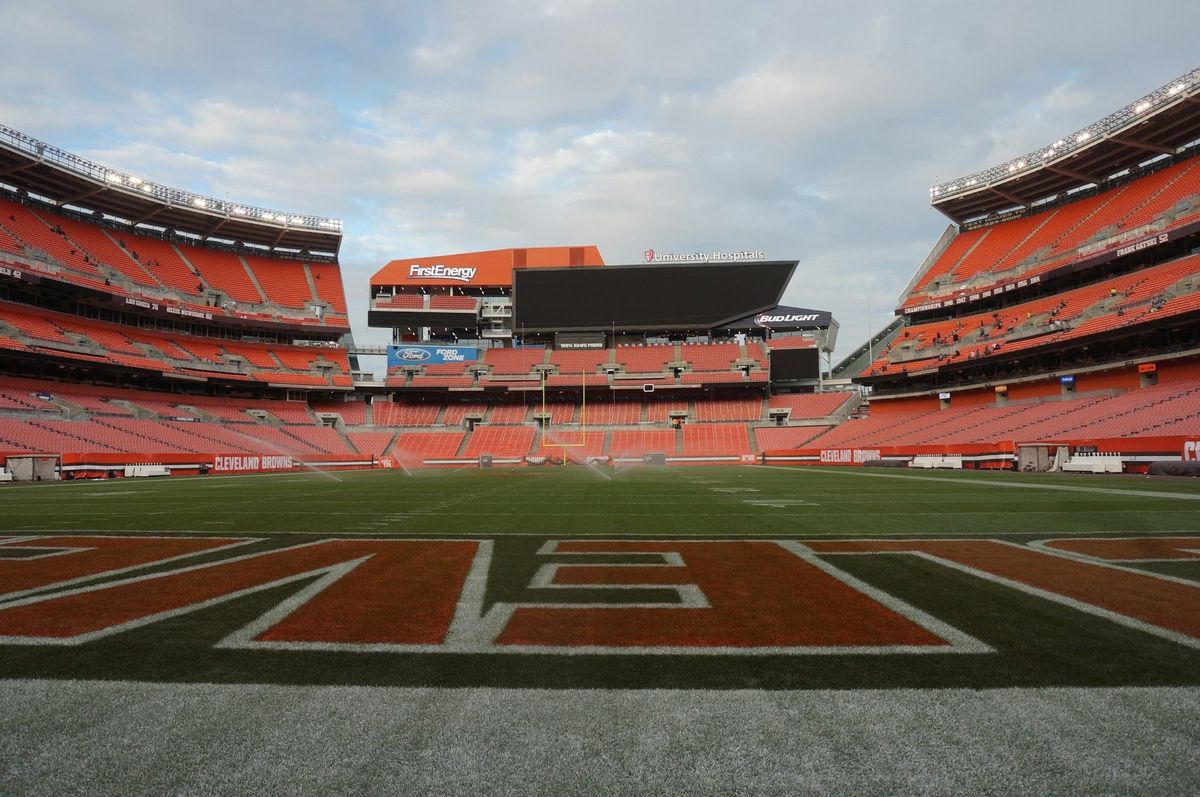
I last ran this list over at Football Outsiders back in 2021, but we've had some important advancements in the field of loserdom in the years since. Both New York teams have struggled to get out of their own way, firing coaches left and right. The Jets have turned their scouting over to a combination of Madden ratings and AI. The Giants watched one of their franchise tentpoles go to a rival and immediately win a Super Bowl. Outside of New York, the Panthers have seen a new owner throwing drinks at fans. And the Browns, of course, continue to explore the full spectrum of what makes a team a nightmare to watch.
Those four teams have been updated and added to the countdown, as have all the advancements in DVOA over the last five years. That gives us a nice round 60 franchises to count down over the next month and a half, as we cross the doldrums between OTAs and training camp. And hey, if this blog crashes and burns along with them, then it's a fitting way to go.
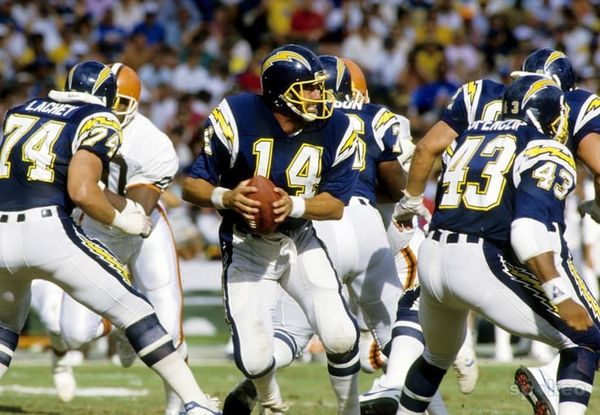
If all you care about are reading about the terrible teams, good news! You're caught up, and the first post, covering the 1980s San Diego Chargers, is already live. If you want the big ol' table with all the teams we'll be covering? We can do that, too. And then, if you want the nitty-gritty methodology, we'll have that after the paywall.
The Anti-Dynasties
The NFL has existed in its current form for 106 years. In that time 60 different teams earned dynasty scores of at least 30 points. The following table lists them all. It includes the number of seasons each era lasted, their high point in anti-dynasty points, and their win-loss record. Then you have their last-place finishes, including conference and divisional worst for modern teams. Finally, you have their DVOAs—both the average across the entire run of the era, as well as the average of their bottom five seasons. We remember terrible teams by their low points, after all, so that last column gives a better look at which teams failed the hardest. Teams with runs of less than five seasons have 0.0% seasons added as needed.
For teams before 1977, we use two sources to give them values. For teams from 1950-1976, we use estimated DVOA, courtesy of Ethan Christopherson. Before that, we don't even have enough data to run those estimations, so we instead use Pro Football Reference's Simple Rating System—a rating that takes into account average point differential and strength of schedule, both of which we have going all the way back to the beginning. When you start talking about "average performance" in a league where teams fold, merge, and form at the drop of a hat, you're getting into murky waters anyway; this is about as good as an approximation as we are going to get.
| NFL Teams With 30+ Anti-Dynasty Points, 1920-2020 | ||||||||||||
| Seasons | Team | Years | Anti-Dynasty | W | L | T | Win% | Last Place In: | Avg DVOA | Bottom-5 DVOA | ||
| Points | NFL | Conf | Div | |||||||||
| 1995-2025 | Cleveland Browns | 28 | 125 | 151 | 301 | 1 | 0.334 | 5 | 5 | 18 | -14.7% | -36.7% |
| 1967-1986 | New Orleans Saints | 20 | 118 | 90 | 196 | 5 | 0.318 | 2 | 5 | 10 | -16.1% | -28.8% |
| 1926-1945 | Chicago Cardinals | 20 | 115 | 59 | 142 | 15 | 0.308 | 6 | 6 | 9 | -14.8% | -21.8% |
| 1985-2006 | St. Louis/Phoenix/Arizona Cardinals | 22 | 106 | 121 | 229 | 1 | 0.346 | 1 | 5 | 11 | -19.4% | -33.9% |
| 1983-1996 | Tampa Bay Buccaneers | 14 | 95 | 64 | 159 | 0 | 0.287 | 3 | 4 | 11 | -23.1% | -32.5% |
| 1933-1942 | Philadelphia Eagles | 10 | 84 | 23 | 82 | 4 | 0.229 | 3 | 3 | 6 | -21.1% | -29.1% |
| 1991-2002 | Cincinnati Bengals | 12 | 82 | 55 | 137 | 0 | 0.286 | 3 | 3 | 5 | -22.0% | -32.7% |
| 2001-2015 | Detroit Lions | 15 | 82 | 78 | 162 | 0 | 0.325 | 1 | 4 | 9 | -13.3% | -32.4% |
| 1960-1972 | Denver Broncos | 13 | 80 | 53 | 123 | 6 | 0.308 | 5 | 5 | 8 | -18.1% | -37.7% |
| 2008-2021 | Jacksonville Jaguars | 14 | 78 | 67 | 158 | 0 | 0.298 | 3 | 3 | 8 | -18.4% | -33.4% |
| 1948-1958 | Green Bay Packers | 11 | 74 | 37 | 93 | 2 | 0.288 | 2 | 2 | 5 | -18.4% | -31.8% |
| 2005-2016 | St. Louis/Los Angeles Rams | 12 | 71 | 60 | 131 | 1 | 0.315 | 2 | 2 | 6 | -18.2% | -34.5% |
| 1971-1983 | New York Giants | 13 | 66 | 61 | 124 | 2 | 0.332 | 1 | 3 | 6 | -12.4% | -23.9% |
| 1933-1941 | Pittsburgh Pirates/Steelers (NOTE: 42-46) | 9 | 65 | 25 | 71 | 6 | 0.275 | 2 | 2 | 5 | -26.9% | -33.6% |
| 1978-1986 | Baltimore/Indianapolis Colts | 9 | 65 | 38 | 98 | 1 | 0.281 | 2 | 3 | 5 | -21.4% | -29.1% |
| 2016-2025 | New York Jets | 10 | 65 | 49 | 116 | 0 | 0.297 | 1 | 2 | 7 | -20.0% | -27.6% |
| 1950-1959 | Chicago Cardinals | 10 | 62 | 33 | 84 | 3 | 0.288 | 4 | 4 | 7 | -12.7% | -18.3% |
| 1923-1929 | Dayton Triangles | 7 | 59 | 5 | 42 | 4 | 0.137 | 3 | 3 | 3 | -16.8% | -23.5% |
| 1967-1977 | Philadelphia Eagles | 11 | 59 | 48 | 100 | 6 | 0.331 | 1 | 2 | 6 | -15.8% | -22.8% |
| 1957-1970 | Washington Redskins | 14 | 58 | 64 | 112 | 12 | 0.372 | 1 | 1 | 2 | -12.2% | -27.9% |
| 1967-1975 | Boston/New England Patriots | 9 | 58 | 37 | 88 | 1 | 0.298 | 1 | 1 | 4 | -18.7% | -30.8% |
| 1964-1971 | Pittsburgh Steelers | 8 | 56 | 30 | 79 | 3 | 0.281 | 1 | 1 | 3 | -17.5% | -23.0% |
| 1967-1972 | Buffalo Bills | 6 | 55 | 17 | 64 | 3 | 0.220 | 2 | 2 | 2 | -20.4% | -22.0% |
| 2017-2025 | New York Giants | 9 | 55 | 44 | 104 | 1 | 0.299 | 0 | 2 | 5 | -19.0% | -25.6% |
| 1990-1998 | Los Angeles/St. Louis Rams | 9 | 54 | 45 | 99 | 0 | 0.313 | 0 | 2 | 8 | -14.5% | -18.3% |
| 2003-2009 | Oakland Raiders | 7 | 54 | 29 | 83 | 0 | 0.259 | 2 | 2 | 5 | -21.6% | -25.8% |
| 1983-1997 | Atlanta Falcons | 15 | 53 | 86 | 152 | 1 | 0.362 | 1 | 3 | 9 | -10.6% | -25.3% |
| 1987-1996 | New York Jets | 10 | 50 | 54 | 104 | 1 | 0.343 | 2 | 3 | 5 | -11.1% | -21.0% |
| 1959-1965 | Los Angeles Rams | 7 | 49 | 25 | 65 | 4 | 0.287 | 2 | 2 | 3 | -5.0% | -9.0% |
| 1969-1975 | Chicago Bears | 7 | 47 | 28 | 69 | 1 | 0.291 | 1 | 1 | 6 | -14.1% | -19.0% |
| 1981-1986 | Houston Oilers | 6 | 47 | 23 | 66 | 0 | 0.258 | 1 | 1 | 5 | -28.5% | -33.0% |
| 2001-2013 | Buffalo Bills | 13 | 46 | 80 | 128 | 0 | 0.385 | 0 | 2 | 9 | -7.8% | -15.8% |
| 1921-1930 | Minneapolis Marines/Red Jackets | 6 | 44 | 6 | 33 | 3 | 0.179 | 1 | 1 | 1 | -14.6% | -18.3% |
| 2011-2019 | Tampa Bay Buccaneers | 9 | 44 | 49 | 95 | 0 | 0.340 | 1 | 1 | 7 | -12.2% | -18.5% |
| 2018-2025 | Carolina Panthers | 7 | 44 | 44 | 89 | 0 | 0.331 | 1 | 1 | 3 | -18.2% | -26.0% |
| 1970-1977 | New York Jets | 8 | 43 | 37 | 75 | 0 | 0.330 | 0 | 0 | 3 | -16.1% | -22.7% |
| 1970-1973 | Houston Oilers | 4 | 42 | 9 | 45 | 2 | 0.179 | 2 | 2 | 3 | -23.4% | -18.7% |
| 1989-1995 | New England Patriots | 7 | 42 | 35 | 77 | 0 | 0.313 | 2 | 2 | 2 | -25.1% | -32.1% |
| 1997-2003 | San Diego Chargers | 7 | 42 | 35 | 77 | 0 | 0.313 | 2 | 2 | 6 | -13.2% | -18.7% |
| 1973-1980 | San Francisco 49ers | 8 | 41 | 39 | 79 | 0 | 0.331 | 2 | 2 | 3 | -9.6% | -16.8% |
| 1966-1970 | Atlanta Falcons | 5 | 40 | 16 | 51 | 3 | 0.250 | 2 | 2 | 2 | -23.8% | -23.8% |
| 1942-1945 | Brooklyn Dodgers/Tigers | 4 | 38 | 8 | 32 | 1 | 0.207 | 1 | 1 | 2 | -22.8% | -18.3% |
| 1946-1949 | Detroit Lions | 4 | 37 | 10 | 37 | 0 | 0.213 | 2 | 2 | 3 | -21.0% | -16.8% |
| 1970-1976 | San Diego Chargers | 7 | 37 | 30 | 63 | 5 | 0.332 | 1 | 1 | 4 | -13.5% | -17.7% |
| 1931-1939 | Brooklyn Dodgers | 9 | 36 | 33 | 63 | 8 | 0.356 | 0 | 0 | 0 | -17.5% | -23.6% |
| 1944-1948 | Boston Yanks | 5 | 36 | 14 | 38 | 3 | 0.282 | 0 | 0 | 2 | -27.0% | -10.0% |
| 1974-1979 | Kansas City Chiefs | 6 | 36 | 28 | 60 | 0 | 0.318 | 1 | 2 | 4 | -14.9% | -17.7% |
| 1984-1990 | Detroit Lions | 7 | 36 | 37 | 73 | 1 | 0.338 | 0 | 0 | 3 | -12.0% | -15.2% |
| 2003-2010 | San Francisco 49ers | 8 | 36 | 46 | 82 | 0 | 0.359 | 1 | 1 | 2 | -22.5% | -32.3% |
| 1921-1925 | Rochester Jeffersons | 5 | 35 | 2 | 24 | 2 | 0.107 | 4 | 4 | 4 | -33.0% | -33.6% |
| 1982-1987 | Buffalo Bills | 6 | 35 | 27 | 61 | 0 | 0.307 | 2 | 2 | 2 | -14.2% | -18.6% |
| 1960-1964 | Dallas Cowboys | 5 | 34 | 18 | 46 | 4 | 0.294 | 1 | 1 | 1 | -14.2% | -14.2% |
| 1920-1926 | Hammond Pros | 7 | 33 | 7 | 28 | 4 | 0.231 | 2 | 2 | 2 | -9.2% | -16.3% |
| 1973-1980 | Green Bay Packers | 8 | 33 | 42 | 72 | 4 | 0.373 | 0 | 0 | 3 | -14.2% | -20.5% |
| 1976-1980 | Tampa Bay Buccaneers | 5 | 33 | 22 | 53 | 1 | 0.296 | 2 | 2 | 4 | -23.0% | -23.0% |
| 1983-1991 | San Diego Chargers | 9 | 33 | 55 | 88 | 0 | 0.385 | 0 | 0 | 5 | -5.2% | -10.2% |
| 1994-2001 | New Orleans Saints | 8 | 32 | 49 | 79 | 0 | 0.383 | 0 | 2 | 3 | -13.6% | -21.2% |
| 2002-2006 | Houston Texans | 5 | 32 | 24 | 56 | 0 | 0.300 | 1 | 1 | 4 | -23.8% | -23.8% |
| 1920-1922 | Columbus Panhandles | 3 | 30 | 3 | 22 | 2 | 0.148 | 0 | 0 | 0 | -22.2% | -13.3% |
| 2015-2018 | San Francisco 49ers | 4 | 30 | 17 | 47 | 0 | 0.266 | 0 | 1 | 3 | -19.9% | -15.9% |
A wretched hive of scum and villainy, to be sure, and a pretty thorough accounting thereof. There are some individual terrible teams that don't make the list; no 1991 Colts or 2012 Chiefs to be found here. But if you're looking for the most painful stretches of football the last century has ever seen, they're all here.